
Authors
Mariia Mamontova, Yelyzaveta Nyzhnyk, Nazarii Melnyk, Vitalii Alekseiko
Abstract
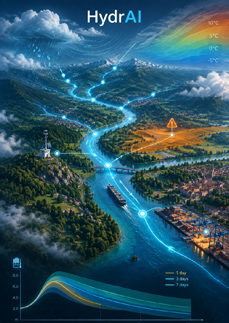
HydrAI addresses water-level forecasting across the Danube basin for flood-risk awareness,hydrological operations and river-dependent logistics. It models the river system as aphysically directed graph rather than treating monitoring stations independently. The projectcombines recent water-level histories with weather variables to estimate one-, three- andseven-day horizons. Its stated audience includes national hydrological institutions, forecastingstations and businesses whose shipping and logistics depend on the Danube. The workresponds to limitations the team identified in computationally intensive physical systems andpoint-based learning methods.
HydrAI extends work presented by the team in the previous year’s competition. That local casestudy examined a monitoring station in Lower Austria and indicated that a wavelet transformimproved short-term predictive accuracy. It also revealed that models based only on localhistorical water levels were inadequate for medium- and long-term horizons and were blind toexternal weather anomalies and events absent from the original history.
The new system expands the analysis to a basin graph comprising 47 physical monitoringstations on the main channel and 11 major tributaries. Edges enforce upstream-to-downstreamflow. Their weights are derived from shortest-path distance along the river bed through aGaussian kernel, with a threshold used to maintain graph sparsity. Each node receives itscurrent water level and nine ERA5-Land weather variables. A shared GRU encodes a fourteendaysequence; three graph-attention convolution layers then transmit spatial information. Fourattention heads address differing propagation patterns, while residual connections support training across the reported 18 physical hops from source to delta. Separate outputs aregenerated for one, three and seven days, with early stopping and a dynamic learning-rateschedule used to limit overfitting.
The demonstrated hosted interface included an architectural overview, an OpenStreetMapbaseddashboard and interactive, colour-coded monitoring nodes. A forecasting page allowedthe horizon and other hyperparameters to be modified before displaying results and evaluationmetrics. A separate optimisation tab exposed the built-in genetic algorithm, includingconfigurable population sizes and generation limits.
license
Creative Commons BY-SA 4.0
Language
English
Year of publication
2026
price
FREE
Learning materials
other sources - mind map
created with support of

Co-funded by the European Union. The views and opinions expressed are those of the authors and do not necessarily reflect those of the European Union or the Czech National Agency for International Education and Research. Neither the European Union nor the grant provider is responsible for them.